New Jersey Foreclosures and Distressed Properties Statewide: Ocean to Cape May County Rankings
Every New Jersey buyer can see the foreclosure listings on Zillow, Realtor.com, and Auction.com. ForeclosuresDaily.com finds distressed property earlier, connecting you privately and off the MLS with motivated owners who want to sell quickly.



















Hear From Our Customers
Click a profile to watch their video or read their story.






New Jersey’s housing market by the numbers
Local market snapshot
Market data: Realtor.com New Jersey housing market, October 2026. Zillow Home Value Index for New Jersey: $580,353 (up 3.9% from a year earlier), August 2026. View homes on Zillow.
What turns a New Jersey home into a distressed property?
A property becomes distressed when circumstances push its owner to sell. Typical triggers include a missed mortgage payment, a death in the family, divorce, a property tax balance that has gone unpaid, or repairs the owner has no way to pay for.

New Jersey sellers under pressure are especially valuable to investors. Retail deals rarely pencil out when the median listing price is near $600,000.
Discounts come from owners who sell privately, without public advertising or a spot on the Multiple Listing Service (MLS). That keeps competition low and leaves room for wholesale pricing.
Measured by inventory, Ocean County, Monmouth County, and Middlesex County are the busiest New Jersey markets right now, and more listings there mean more owners feeling pressure.
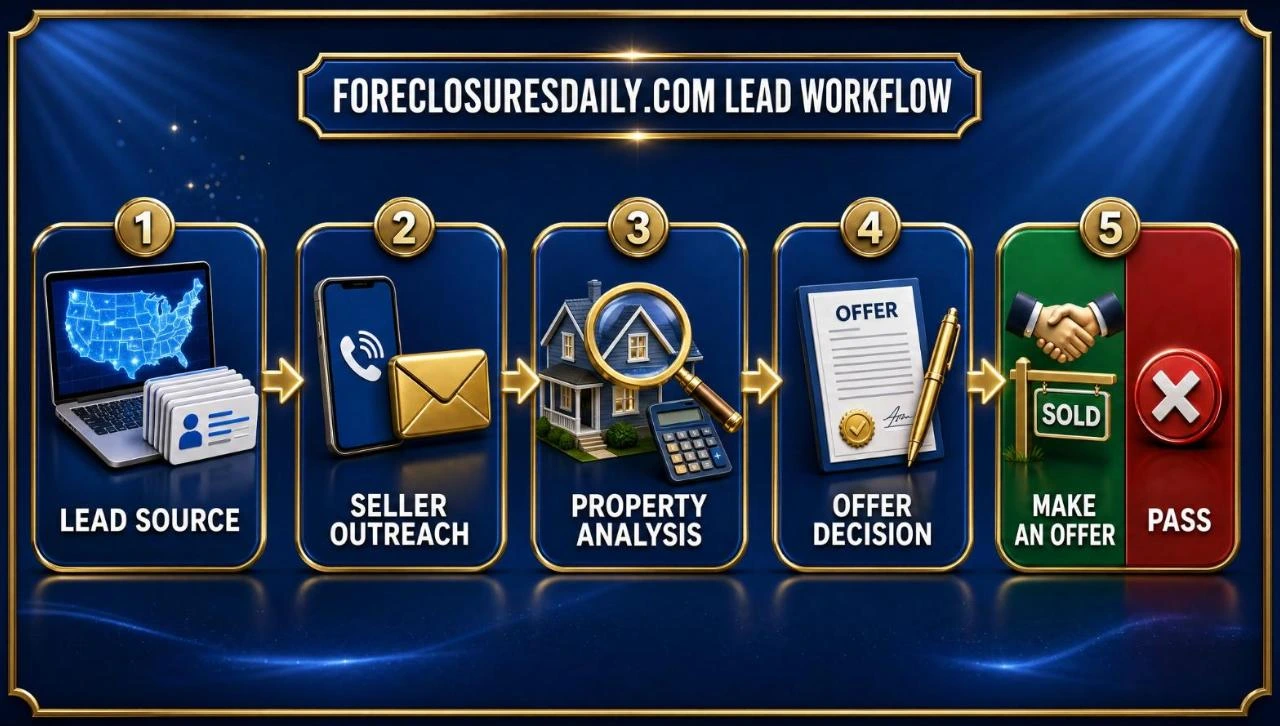
Finding New Jersey distressed owners before the auction
A home reaches the foreclosure sites only after the bank or auction is involved. New Jersey cases start sooner, because the Fair Foreclosure Act requires a Notice of Intention to Foreclose at least 30 days before filing, so begin there:
- Pick your counties Concentrate on a few New Jersey counties where you understand pricing and have cash buyers ready to close.
- Choose lead types Probate, pre-foreclosure, divorce, code violation, and tax delinquency records reveal different motives, so match the lead type to the deal you want.
- Use fresh data New ForeclosuresDaily leads arrive every day, so your outreach lands with New Jersey owners before other investors’ mailers do.
- Target your marketing Spend the outreach budget on New Jersey owners with a documented reason to sell rather than blanket mailings.
- Run the numbers Use comparable nearby sales to set the after-repair value (ARV), then measure your offer against the 70% Rule.
- Make a fair offer Close quickly in cash and buy as-is to solve the seller’s problem, then assign the contract or renovate and resell.
New Jersey sellers who need to move quickly
Across New Jersey, ForeclosuresDaily.com’s off-market platform follows every major distress signal and cross-checks it with tax rolls and property appraiser records.
Lead types to work









New Jersey flip math: ARV and the 70% Rule
Wholesalers and flippers set a maximum offer by working back from the after-repair value (ARV).
No more than 70% of ARV, minus repairs: that is the 70% Rule’s ceiling on your price. In New Jersey, the margin it leaves has to cover holding and closing costs plus flip profit, or your assignment fee if you wholesale.

These examples use the New Jersey median listing price as the ARV and budget 8% of it for repairs.
70% Rule example
| Step | Amount |
|---|---|
| ARV | $599,000 |
| 70% of ARV | $419,300 |
| Estimated repairs | − $48,000 |
| Maximum offer |
New Jersey counties ranked for investors
Below are the 10 New Jersey counties with the largest number of homes for sale. Expand any county for its investing data and choose the market that fits your approach.

Below state median · Ocean County · $534,900 · Wholesale
Ocean County market snapshot
| Metric | Value |
|---|---|
| Median listing price | $534,900 ▼ 2.6% |
| Price per sq ft | $308 |
| Days on market | 49 days ▲ 4.3% |
| Median rent | $3,000 |
| Active listings | 4,714 ▲ 5.9% |
| Gross rent yield | 6.7% |
Meanwhile, Ocean County’s Zillow Home Value Index came to $551,072 in August 2026, up 4.8% from a year earlier.
Ocean County holds the largest inventory on this list, giving you more owners to contact. The median price slipped 2.6% while inventory rose 5.9%, and with prices near the area median, the profit lies in deep off-market discounts.
Max offer when the ARV equals the median price: $534,900 × 70% − $43,000 repairs = $331,430 max offer
Also see the full Ocean County market report on Realtor.com →
Then view Ocean County homes on Zillow →

Above state median · Monmouth County · $829,000 · Flip
Monmouth County market snapshot
| Metric | Value |
|---|---|
| Median listing price | $829,000 ▲ 3.6% |
| Price per sq ft | $402 |
| Days on market | 44 days ▼ 2.2% |
| Median rent | $3,200 |
| Active listings | 3,346 ▲ 4.5% |
| Gross rent yield | 4.6% |
Meanwhile, in Monmouth County, the Zillow Home Value Index reached $793,713 as of August 2026, a 6.5% increase over the year.
Monmouth County’s median price gained 3.6% and inventory rose 4.5% from last year. Strong resale values reward a renovation that is planned with care.
Max offer when the ARV equals the median price: $829,000 × 70% − $66,000 repairs = $514,300 max offer
Also see the full Monmouth County market report on Realtor.com →
Then view Monmouth County homes on Zillow →
Below state median · Middlesex County · $575,000 · Negotiate
Middlesex County investing snapshot
| Metric | Value |
|---|---|
| Median listing price | $575,000 ▲ 2.7% |
| Price per sq ft | $352 |
| Days on market | 44 days ▲ 15.8% |
| Median rent | $2,662 ▼ 1.4% |
| Active listings | 3,014 ▲ 20.3% |
| Gross rent yield | 5.6% |
In addition, Middlesex County carried a Zillow Home Value Index of $588,036 in August 2026, 3.1% higher than a year before.
Middlesex County’s median price is up 2.7% on the year, but inventory jumped 20.3%. More competing listings give you room to negotiate with motivated owners.
Max offer when the ARV equals the median price: $575,000 × 70% − $46,000 repairs = $356,500 max offer
Also see the full Middlesex County market report on Realtor.com →
Then view Middlesex County homes on Zillow →
Above state median · Hudson County · $599,999 · Wholesale
Hudson County market snapshot
| Metric | Value |
|---|---|
| Median listing price | $599,999 ▲ 0.2% |
| Price per sq ft | $557 |
| Days on market | 43 days ▼ 6.5% |
| Median rent | $2,795 ▲ 1.1% |
| Active listings | 2,581 ▲ 18.6% |
| Gross rent yield | 5.6% |
Similarly, Hudson County’s Zillow Home Value Index sat at $640,103 for August 2026, 1.2% above a year earlier.
Hudson County’s median price barely moved, up 0.2%, while inventory grew 18.6%. Balanced pricing makes the county a steady source of wholesale deals.
Max offer when the ARV equals the median price: $599,999 × 70% − $48,000 repairs = $371,999 max offer
Also see the full Hudson County market report on Realtor.com →
Then view Hudson County homes on Zillow →

Above state median · Bergen County · $774,950 · Negotiate
Bergen County market snapshot
| Metric | Value |
|---|---|
| Median listing price | $774,950 ▼ 3.1% |
| Price per sq ft | $412 |
| Days on market | 38 days ▲ 11.8% |
| Median rent | $2,950 |
| Active listings | 2,262 ▲ 16.9% |
| Gross rent yield | 4.6% |
In addition, Likewise, Bergen County recorded a Zillow Home Value Index of $786,765 as of August 2026, up 6.9% year over year.
In Bergen County the median price fell 3.1% and inventory climbed 16.9%. Sellers are adjusting to slower demand, so below-asking offers get serious attention.
Max offer when the ARV equals the median price: $774,950 × 70% − $62,000 repairs = $480,465 max offer
Also see the full Bergen County market report on Realtor.com →
Then view Bergen County homes on Zillow →

Below state median · Atlantic County · $419,000 · Flip & wholesale
Atlantic County market snapshot
| Metric | Value |
|---|---|
| Median listing price | $419,000 ▼ 2.4% |
| Price per sq ft | $254 |
| Days on market | 58 days ▲ 1.9% |
| Median rent | $2,232 ▼ 7% |
| Active listings | 2,227 ▼ 2.4% |
| Gross rent yield | 6.4% |
Moreover, Atlantic County posted a Zillow Home Value Index of $385,559 in August 2026, 3.9% above the prior year.
Atlantic County’s median price is 2.4% under last year. With lower prices, a wholesale deal or a light flip ties up less of your cash.
Max offer when the ARV equals the median price: $419,000 × 70% − $34,000 repairs = $259,300 max offer
Also see the full Atlantic County market report on Realtor.com →
Then view Atlantic County homes on Zillow →

Above state median · Essex County · $599,000 · Wholesale
Essex County market snapshot
| Metric | Value |
|---|---|
| Median listing price | $599,000 |
| Price per sq ft | $340 |
| Days on market | 40 days ▼ 2.4% |
| Median rent | $2,300 ▼ 2.1% |
| Active listings | 2,102 ▲ 17.1% |
| Gross rent yield | 4.6% |
Similarly, the Zillow Home Value Index for Essex County was $664,986 in August 2026, a 3.7% climb from a year earlier.
Essex County inventory is 17.1% higher than a year ago. Off-market leads are where you will find the discount that retail listings do not offer.
Max offer when the ARV equals the median price: $599,000 × 70% − $48,000 repairs = $371,300 max offer
Also see the full Essex County market report on Realtor.com →
Then view Essex County homes on Zillow →
Below state median · Burlington County · $411,000 · Buy & hold
Burlington County market snapshot
| Metric | Value |
|---|---|
| Median listing price | $411,000 ▼ 2.1% |
| Price per sq ft | $243 |
| Days on market | 37 days ▲ 12.1% |
| Median rent | $2,500 ▲ 8.2% |
| Active listings | 2,028 ▲ 17.4% |
| Gross rent yield | 7.3% |
Meanwhile, Burlington County’s Zillow Home Value Index stood at $423,352 in August 2026, a 2.3% annual increase.
Burlington County sells homes faster than any other county here. The median price dipped 2.1% while inventory rose 17.4%, and rents cover a bigger slice of the price, which helps rental investors.
Max offer when the ARV equals the median price: $411,000 × 70% − $33,000 repairs = $254,700 max offer
Also see the full Burlington County market report on Realtor.com →
Then view Burlington County homes on Zillow →
Below state median · Camden County · $375,000 · Flip & wholesale
Camden County market snapshot
| Metric | Value |
|---|---|
| Median listing price | $375,000 ▲ 7.1% |
| Price per sq ft | $223 |
| Days on market | 39 days ▲ 8.1% |
| Median rent | $2,000 ▼ 8.1% |
| Active listings | 2,027 ▲ 10.6% |
| Gross rent yield | 6.4% |
In addition, Camden County logged a Zillow Home Value Index of $359,108 as of August 2026, 4.3% higher than a year earlier.
Camden County has the lowest entry prices in this group, a good match for wholesaling and first flips. Its median price rose 7.1% and inventory grew 10.6%, and those entry prices still leave room for an assignment fee or a quick resale.
Max offer when the ARV equals the median price: $375,000 × 70% − $30,000 repairs = $232,500 max offer
Also see the full Camden County market report on Realtor.com →
Then view Camden County homes on Zillow →
Above state median · Cape May County · $899,000 · Flip
Cape May County market snapshot
| Metric | Value |
|---|---|
| Median listing price | $899,000 ▲ 5.8% |
| Price per sq ft | $603 |
| Days on market | 65 days ▲ 1.6% |
| Median rent | $2,000 ▼ 21.6% |
| Active listings | 1,662 ▼ 4.7% |
| Gross rent yield | 2.7% |
Similarly, Cape May County reached a Zillow Home Value Index of $806,250 in August 2026, up 9.3% from the prior year.
Cape May County leads this list on price per square foot. The median price rose 5.8% and inventory dipped 4.7%, and prices that strong support a full renovation with a solid margin.
Max offer when the ARV equals the median price: $899,000 × 70% − $72,000 repairs = $557,300 max offer
Also see the full Cape May County market report on Realtor.com →
Then view Cape May County homes on Zillow →
Expand each New Jersey county to weigh it against the others. Listing data is from Realtor.com, October 2026; values are from the Zillow Home Value Index, August 2026.
Gross rent yield is a year of median rent, 12 months, divided by the median listing price. Repairs in each 70% Rule example equal 8% of the median price.
Beat other buyers to New Jersey motivated sellers
Investors, wholesalers, flippers, and agents in New Jersey and beyond have used ForeclosuresDaily.com since 2004 to contact motivated sellers before anyone else.
Why off-market deals work
New Jersey questions about distressed and foreclosure properties
Which public records reveal New Jersey distressed properties?
Start with pre-foreclosure filings, probate cases, divorce records, and tax delinquencies. In New Jersey a foreclosure is filed in the Superior Court, Chancery Division, and a lis pendens is recorded with the county clerk. ForeclosuresDaily.com collects these records daily so you can contact owners before a listing or a sheriff’s sale.
Where are foreclosed New Jersey homes advertised?
For example, Realtor.com, Zillow, and Auction.com carry the bank-owned and auction inventory every New Jersey buyer can see. Before that, each county sheriff holds the foreclosure sale, which is often adjourned. Pre-foreclosure leads let you reach owners while they can still sell on their own terms.
Where are New Jersey’s least expensive counties for investors?
Camden County has the lowest median listing price in this guide at $375,000, followed by Burlington County at $411,000 and Atlantic County at $419,000. All three figures come from Realtor.com data for October 2026 and sit below the $599,000 county median.
If speed matters, which New Jersey county should you watch?
Burlington County has the shortest average time on market in this guide, 37 days, versus a typical 44 days across these 10 counties. Quick markets like that favor investors who reach owners before a home is listed.
How do you size up a New Jersey distressed property for wholesale?
Begin with owners who hold equity and face a deadline. A deal works when your contract price passes the 70% Rule and a cash buyer in that county is already waiting to take the assignment.
Get New Jersey distressed property leads today
Fresh, targeted, off-market data for Ocean County, Monmouth County, Middlesex County, and beyond.

More New Jersey pages
Other New Jersey local pages
- Distressed Real Estate in Camden County, New Jersey
- Distressed Real Estate in Essex County, New Jersey
- Distressed Real Estate in Hudson County, New Jersey
- Distressed Real Estate in Middlesex County, New Jersey
- Distressed Real Estate in Ocean County, New Jersey
- Distressed Real Estate in Passaic County, New Jersey
- Distressed Real Estate in Union County, New Jersey
- Divorce Leads Bergen County
- Divorce Leads Hudson County
- Divorce Leads Passaic County
- Eviction Leads in Camden County, New Jersey
- Eviction Leads in Essex County, New Jersey
- Eviction Leads in Hudson County, New Jersey
- Eviction Leads in Middlesex County, NJ
- Eviction Leads in Monmouth County, NJ
- Eviction Leads in Ocean County, New Jersey
- Eviction Leads in Passaic County, New Jersey
- Eviction Leads in Union County, New Jersey
- Flipping Houses in Elizabeth, NJ
- Flipping Houses in Jersey City
- Foreclosure Lis Pendens Atlantic County NJ
- Foreclosure Lis Pendens Burlington County NJ
- Foreclosure Lis Pendens Camden County NJ
- Foreclosure Lis Pendens Cape May County NJ
- Foreclosure Lis Pendens Cumberland County NJ
- Foreclosure Lis Pendens Essex County NJ
- Foreclosure Lis Pendens Hudson County New Jersey
- Foreclosure Lis Pendens Middlesex New Jersey
- Foreclosure Lis Pendens Monmouth County New Jersey
- Foreclosure Lis Pendens Passaic County New Jersey
- Foreclosure Lis Pendens Union County New Jersey
- Foreclosure Lis Pends Bergen County NJ
- Monmouth County Foreclosures
- Off-Market Property Camden County NJ
- Off-Market Property Essex County NJ
- Off-Market Property Hudson County
- Off-Market Property Middlesex County NJ
- Off-Market Property Monmouth County
- Off-Market Property Ocean County
- Off-Market Property Passaic County
- Off-Market Property Union County NJ
- Platform Bergen, NJ
- Probate Real Estate Leads in Newark, NJ
- Probate Real Estate Leads in Sussex County, New Jersey
- Real Estate Investing in Camden County, NJ
- Real Estate Investing in Essex County, NJ
- Real Estate Investing in Middlesex County, NJ
- Real Estate Investing in Monmouth County, NJ
- Real Estate Investing in Ocean County, NJ
- Real Estate Investing in Passaic County, NJ
- Real Estate Investing in Union County, NJ
- Real Estate Listing Platform for Camden County, NJ
- Real Estate Listing Platform for Essex County, NJ
- Real Estate Listing Platform for Hudson County, NJ
- Real Estate Listing Platform for Middlesex County, NJ
- Real Estate Listing Platform for Monmouth County, NJ
- Real Estate Listing Platform for Ocean County, NJ
- Real Estate Listing Platform for Passaic County, NJ
- Real Estate Listing Platform for Union County, NJ
- Realtor Leads in Bergen County, NJ
More New Jersey guides