Minnesota Foreclosures and Distressed Properties Statewide: Hennepin to Stearns County
However, foreclosures listed on Zillow, Realtor.com, and Auction.com are visible to every investor in the state. ForeclosuresDaily.com helps you find distressed owners sooner, while they can still sell privately and before a listing reaches the MLS.
























Hear From Our Customers
Click a profile to watch their video or read their story.






Where the Minnesota housing market stands now
Local market snapshot
Market data: Realtor.com Minnesota housing market, October 2026. Zillow Home Value Index for Minnesota: $350,752 (up 2.5% from a year earlier), August 2026. View homes on Zillow.
How a Minnesota home becomes distressed
Distress means the owner needs to sell because a problem forces the issue. In Minnesota, that problem is usually a missed mortgage payment, a death in the family, a divorce, a delinquent property tax bill, or repairs beyond the owner’s budget.

Minnesota’s median listing price sits near $390,000. As a result, a few points of discount separate a profitable flip from a break-even one.
In fact, most of that discount comes from owners who sell without public advertising or a Multiple Listing Service (MLS) entry. Less competition lets you negotiate a wholesale price rather than bid against retail buyers.
Hennepin County, Dakota County, and Ramsey County lead the state in current inventory. As a result, more listings there translate into more owners under pressure.
Finding Minnesota distressed property early
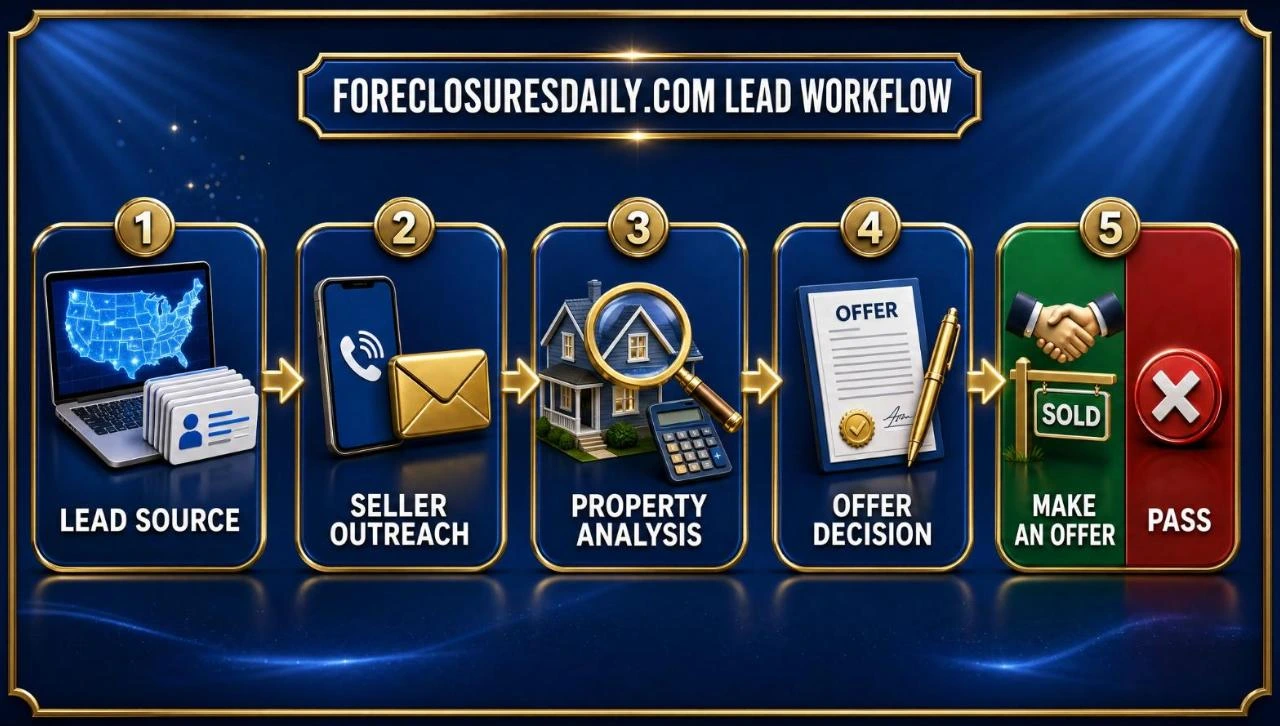
However, a home appears on a foreclosure site only after the lender or the sheriff sale is already in motion. Start sooner with these steps:
- Pick your counties Focus on a few Minnesota counties, such as Ramsey or Anoka, where you know values and have cash buyers ready to close.
- Choose lead types Select the records you will work, since probate, pre-foreclosure, divorce, code violation, and tax delinquency leads each signal a separate reason an owner might sell.
- Use fresh data ForeclosuresDaily refreshes leads daily, so you can contact a Minnesota owner while other investors are still working from stale lists.
- Target your marketing Then aim every letter, call, and text at owners with a real reason to sell, and skip the households that show no sign of moving.
- Run the numbers Then estimate the after-repair value (ARV) from comparable sales in the same county, and apply the 70% Rule to it.
- Make a fair offer Present a quick as-is cash closing that solves the owner’s problem, and decide whether to wholesale or rehab the house.
Minnesota owners looking to sell in a hurry
ForeclosuresDaily.com covers every major distress signal in Minnesota. In addition, it checks each record against county tax rolls and property records.
Lead types to work









Setting a ceiling on Minnesota offers with ARV and the 70% Rule
In general, Wholesalers and flippers in Minnesota set their highest offer from the after-repair value (ARV).
Then the 70% Rule limits your price to 70% of ARV less repairs. The difference pays holding costs, closing costs, and profit on a flip, or becomes your fee when you assign a wholesale contract.

For example, Below, the Minnesota median listing price serves as the ARV, with 8% of it set aside for repairs.
70% Rule example
| Step | Amount |
|---|---|
| ARV | $388,000 |
| 70% of ARV | $271,600 |
| Estimated repairs | − $31,000 |
| Maximum offer |
Where Minnesota inventory piles up: ten counties
The 10 counties below have more homes for sale than any others in Minnesota. Then open one to see its investing data and choose the approach that fits.

Above state median · Hennepin County · $405,000 · Negotiate
Hennepin County market snapshot
| Metric | Value |
|---|---|
| Median listing price | $405,000 ▼ 4.7% |
| Price per sq ft | $220 |
| Days on market | 39 days ▼ 2.5% |
| Median rent | $2,000 ▼ 4.6% |
| Active listings | 5,857 ▲ 20.5% |
| Gross rent yield | 5.9% |
Meanwhile, as of August 2026, Hennepin County’s Zillow Home Value Index sits at $388,061, a 1.5% gain on the year.
In fact, Hennepin County has the highest price per square foot on this list. Its median price dropped 4.7% while inventory rose 20.5% over the year, giving you room to bargain with motivated sellers.
Max offer when the ARV equals the median price: $405,000 × 70% − $32,000 repairs = $251,500 max offer
Also see the full Hennepin County market report on Realtor.com →
Then view Hennepin County homes on Zillow →

Above state median · Dakota County · $425,000 · Negotiate
Dakota County market snapshot
| Metric | Value |
|---|---|
| Median listing price | $425,000 ▼ 5.6% |
| Price per sq ft | $194 |
| Days on market | 37 days ▲ 5.7% |
| Median rent | $2,175 ▼ 9.3% |
| Active listings | 2,281 ▲ 27% |
| Gross rent yield | 6.1% |
In addition, Likewise, Dakota County shows a Zillow Home Value Index of $395,516 for August 2026, a 1.6% gain over twelve months.
Meanwhile, Dakota County rents run high against prices, which appeals to buy-and-hold investors. The median price is down 5.6% and inventory up 27% for the year, so sellers facing slower demand are open to offers below asking.
Max offer when the ARV equals the median price: $425,000 × 70% − $34,000 repairs = $263,500 max offer
Also see the full Dakota County market report on Realtor.com →
Then view Dakota County homes on Zillow →
Below state median · Ramsey County · $318,000 · Negotiate
Ramsey County market snapshot
| Metric | Value |
|---|---|
| Median listing price | $318,000 ▼ 3.6% |
| Price per sq ft | $197 |
| Days on market | 38 days |
| Median rent | $1,600 |
| Active listings | 1,918 ▲ 21.7% |
| Gross rent yield | 6.0% |
Similarly, in Ramsey County, the Zillow Home Value Index stood at $337,589 in August 2026, 1.8% above the prior year.
However, Ramsey County offers the lowest entry price in this group, a match for wholesalers and first-time flippers. The median price fell 3.6% and inventory grew 21.7% over the year, so use the longer selling times to build repairs into your number.
Max offer when the ARV equals the median price: $318,000 × 70% − $25,000 repairs = $197,600 max offer
Also see the full Ramsey County market report on Realtor.com →
Then view Ramsey County homes on Zillow →
Above state median · Anoka County · $415,000 · Negotiate
Anoka County market snapshot
| Metric | Value |
|---|---|
| Median listing price | $415,000 ▼ 6.5% |
| Price per sq ft | $200 |
| Days on market | 35 days ▼ 5.4% |
| Median rent | $2,100 ▼ 7.7% |
| Active listings | 1,564 ▲ 24.2% |
| Gross rent yield | 6.1% |
Moreover, Anoka County’s Zillow Home Value Index matches Ramsey County’s 1.8% annual gain, reaching $372,755 in August 2026.
Anoka County homes sell faster than anywhere else on this list. Similarly, over the year the median price slipped 6.5% and inventory rose 24.2%.
Max offer when the ARV equals the median price: $415,000 × 70% − $33,000 repairs = $257,500 max offer
Also see the full Anoka County market report on Realtor.com →
Then view Anoka County homes on Zillow →

Below state median · St Louis County · $347,000 · Wholesale
Market snapshot for St Louis County
| Metric | Value |
|---|---|
| Median listing price | $347,000 ▲ 8.8% |
| Price per sq ft | $215 |
| Days on market | 51 days ▼ 7.3% |
| Median rent | $1,600 ▲ 15.4% |
| Active listings | 1,558 ▲ 17.5% |
| Gross rent yield | 5.5% |
Meanwhile, the St Louis County median price rose 8.8% in a year, and inventory rose 17.5%. Therefore, with prices near the area median, the margin here depends on deep discounts from off-market owners.
Max offer when the ARV equals the median price: $347,000 × 70% − $28,000 repairs = $214,900 max offer
Also see the full St Louis County market report on Realtor.com →
Then view St Louis County homes on Zillow →

Above state median · Washington County · $495,000 · Negotiate
Market snapshot for Washington County
| Metric | Value |
|---|---|
| Median listing price | $495,000 ▼ 4.4% |
| Price per sq ft | $205 |
| Days on market | 37 days ▼ 2.6% |
| Median rent | $2,372 ▼ 18.1% |
| Active listings | 1,531 ▲ 16.9% |
| Gross rent yield | 5.8% |
Also, in Washington County, the August 2026 Zillow Home Value Index is $446,651, up 2.8% over the year.
Washington County’s median price is 4.4% lower than a year ago, and inventory is up 16.9%.
Max offer when the ARV equals the median price: $495,000 × 70% − $40,000 repairs = $306,500 max offer
Also see the full Washington County market report on Realtor.com →
Then view Washington County homes on Zillow →

Above state median · Olmsted County · $409,000 · Negotiate
Olmsted County market snapshot
| Metric | Value |
|---|---|
| Median listing price | $409,000 ▼ 11.1% |
| Price per sq ft | $194 |
| Days on market | 57 days ▲ 17% |
| Median rent | $1,900 ▲ 8.6% |
| Active listings | 1,300 ▲ 20.6% |
| Gross rent yield | 5.6% |
In addition, Olmsted County’s Zillow Home Value Index reached $350,894 in August 2026, 3.7% higher than the year before.
Olmsted County listings stay on the market longer than any others here, and long waits create motivated sellers. Likewise, the median price fell 11.1% over the year as inventory grew 20.6%.
Max offer when the ARV equals the median price: $409,000 × 70% − $33,000 repairs = $253,300 max offer
Also see the full Olmsted County market report on Realtor.com →
Then view Olmsted County homes on Zillow →
Above state median · Wright County · $437,530 · Wholesale
Wright County market snapshot
| Metric | Value |
|---|---|
| Median listing price | $437,530 ▲ 1.7% |
| Price per sq ft | $195 |
| Days on market | 37 days ▲ 1.3% |
| Median rent | $2,000 ▼ 12.9% |
| Active listings | 1,268 ▲ 17.1% |
| Gross rent yield | 5.5% |
Similarly, Wright County shows a Zillow Home Value Index of $395,181 as of August 2026, up 1.1% over the prior year.
In Wright County the median price edged up 1.7% while inventory climbed 17.1%, and that steady balance supports a regular flow of wholesale deals.
Max offer when the ARV equals the median price: $437,530 × 70% − $35,000 repairs = $271,271 max offer
Also see the full Wright County market report on Realtor.com →
Then view Wright County homes on Zillow →
Above state median · Scott County · $522,186 · Flip
Scott County market snapshot
| Metric | Value |
|---|---|
| Median listing price | $522,186 ▲ 1.4% |
| Price per sq ft | $210 |
| Days on market | 43 days ▲ 2.4% |
| Median rent | $2,547 ▲ 1.9% |
| Active listings | 1,150 ▲ 18.4% |
| Gross rent yield | 5.9% |
Moreover, Likewise, Scott County records a Zillow Home Value Index of $443,102 for August 2026, a 1.3% annual increase.
Scott County has the highest median price on this list, so a single deal can carry a wide margin. The median rose 1.4% and inventory 18.4% over the year. Meanwhile, strong resale values reward a well-planned rehab.
Max offer when the ARV equals the median price: $522,186 × 70% − $42,000 repairs = $323,530 max offer
Also see the full Scott County market report on Realtor.com →
Then view Scott County homes on Zillow →
Below state median · Stearns County · $339,900 · Wholesale
Stearns County market snapshot
| Metric | Value |
|---|---|
| Median listing price | $339,900 ▲ 3.2% |
| Price per sq ft | $169 |
| Days on market | 46 days ▼ 6.1% |
| Median rent | $1,197 ▲ 8.8% |
| Active listings | 961 ▲ 12.3% |
| Gross rent yield | 4.2% |
Moreover, Stearns County’s Zillow Home Value Index was $311,300 in August 2026, 2.6% above a year earlier.
Stearns County has the smallest inventory on the list, so an off-market lead faces little competition. The median price gained 3.2% and inventory rose 12.3%. Therefore, off-market owners are where the discount missing from retail listings shows up.
Max offer when the ARV equals the median price: $339,900 × 70% − $27,000 repairs = $210,930 max offer
Also see the full Stearns County market report on Realtor.com →
Then view Stearns County homes on Zillow →
Then pick a county below to open its investing numbers and compare markets, with listing data from Realtor.com for October 2026 and home values from the August 2026 Zillow Home Value Index.
Also, rent yields shown are gross: 12 months of median rent divided by the median listing price. In addition, the 70% Rule figures put repairs at 8% of the median price.
Minnesota off-market leads ahead of other buyers
Every year since 2004, ForeclosuresDaily.com has helped investors, wholesalers, flippers, and agents reach motivated sellers before rival buyers do.
Why off-market deals work
Answers on Minnesota foreclosures and distressed homes
How do investors find distressed Minnesota properties before a sheriff sale?
First of all, start with public records that show pressure: pre-foreclosure notices, probate cases, divorce filings, and unpaid property taxes. ForeclosuresDaily.com collects them daily, so you can contact Minnesota owners before a listing appears or the county sheriff holds the sale.
Which websites carry Minnesota bank-owned and auction listings?
For example, you will find bank-owned and auction listings for Minnesota on Realtor.com, Zillow, and Auction.com. Minnesota lenders typically foreclose by advertisement, publishing a notice for six weeks before the county sheriff sale, and the owner usually keeps a 6-month redemption period afterward. Pre-foreclosure leads let you reach owners during those windows, while they can still sell.
Where in Minnesota can an investor buy in for the least?
Among the counties in this guide, Ramsey County has the lowest median listing price at $318,000, followed by Stearns County at $339,900 and St Louis County at $347,000, based on Realtor.com data for October 2026. As a result, each sits below the state median, which makes them natural starting points for a first wholesale deal.
In which Minnesota county do listings spend the fewest days on market?
Specifically, Anoka County has the shortest average time on market in this guide, at 35 days. Homes that sell that quickly reward the investor who reaches an owner before a listing goes live, rather than the one who waits for the MLS.
How should a wholesaler approach distressed Minnesota property?
Find owners with equity who need to sell soon, including those still inside a redemption period. Test each price against the 70% Rule, and line up a cash buyer before signing any Minnesota contract you plan to assign.
Get Minnesota distressed property leads today
Fresh, targeted, off-market data for Hennepin County, Dakota County, Ramsey County, and beyond.

More Minnesota pages
Other Minnesota local pages
- Anoka County Realtor Leads
- Distressed Real Estate in Anoka County, Minnesota
- Distressed Real Estate in Cass County, Minnesota
- Distressed Real Estate in Dakota County, Minnesota
- Distressed Real Estate in Hennepin County, Minnesota
- Distressed Real Estate in Ramsey County, Minnesota
- Distressed Real Estate in Washington County, Minnesota
- Off-Market Properties in Anoka County, MN
- Off-Market Properties in Dakota County, MN
- Off-Market Properties in Hennepin County, MN
- Off-Market Properties in Ramsey County, MN
- Off-Market Properties in Washington County, MN
- Probate Real Estate Leads in Minneapolis, MN
- Real Estate Investing and Flipping in Hennepin County, MN
- Realtor Leads Hennepin County MN
- Realtor Leads in Dakota County, MN
- Realtor Leads Washington County MN
- Realtors to Sellers in Minneapolis
- Realtors to Sellers in Rochester, MN
- Realtors to Sellers in St. Paul, MN
- Wholesale Real Estate Saint Paul, Minnesota
- Wholesaling Real Estate in Anoka County, Minnesota
- Wholesaling Real Estate in Dakota County, Minnesota
- Wholesaling Real Estate in Minneapolis, MN
- Wholesaling Real Estate in Washington County, Minnesota
More Minnesota guides