Missouri Foreclosures and Distressed Properties Statewide: St Louis to Boone County Inventory Leaders
Missouri’s REO listings get picked over by every investor with an alert set up. ForeclosuresDaily.com tracks what happens months earlier, including probate filings, missed payments, and delinquent taxes, so your offer reaches motivated sellers before anyone else’s.
























Hear From Our Customers
Click a profile to watch their video or read their story.






Missouri listings, prices, and rent
Local market snapshot
Market data: Realtor.com Missouri housing market, October 2026. Zillow Home Value Index for Missouri: $267,879 (up 3.5% from a year earlier), August 2026. View homes on Zillow.
Signs a Missouri property is distressed
In Missouri, a property is distressed when the owner has to sell under pressure. Common triggers are a missed mortgage payment, a death in the family, a divorce, overdue property taxes, or repairs beyond the owner’s budget.

Landlords and buyers from other states keep a close eye on Missouri, where the median listing price is near $305,000, and any bargain on the open market disappears quickly.
Missouri buyers who keep finding margin skip the bidding and approach owners privately, before the house reaches the Multiple Listing Service (MLS), where there is less competition and more room to negotiate.
Measured by inventory, the busiest Missouri markets today are St Louis County, Jackson County, and St Charles County, and a deep supply of listings often signals sellers who are feeling the squeeze.
Spotting Missouri distressed homes before they list
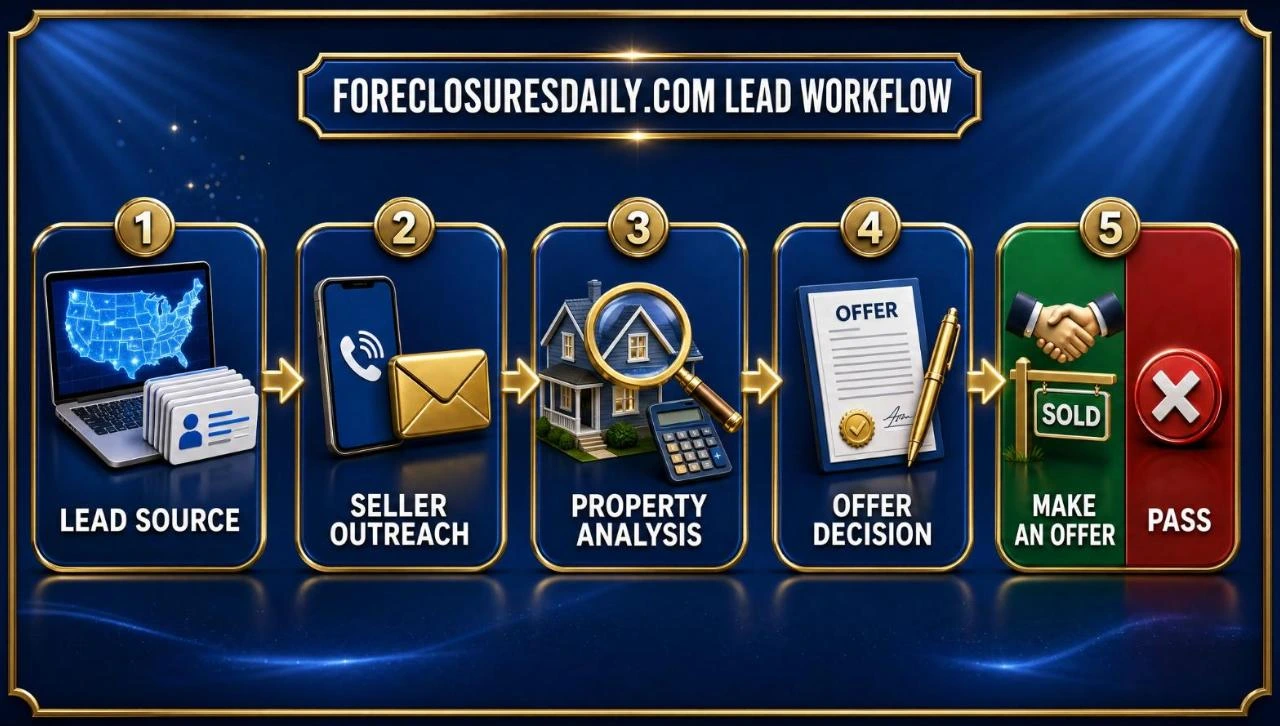
Foreclosure websites catch a Missouri home late, once a lender or auction already has it. The steps below move your search to the months before that:
- Pick your counties Stick to Missouri counties where you can judge a fair price on sight and have buyers ready to take a deal off your hands.
- Choose lead types Match the record to your strategy, because a probate file, a pre-foreclosure, a divorce, a code violation, and a tax delinquency each come with their own seller motive.
- Use fresh data Daily ForeclosuresDaily updates put your letter in a Missouri owner’s mailbox before the stack from other investors arrives.
- Target your marketing Spend postage and phone time only on Missouri owners whose records show real pressure, not on a broad list of everyone in a ZIP code.
- Run the numbers Set an after-repair value (ARV) from comparable Missouri sales, and walk away from any deal that fails the 70% Rule.
- Make a fair offer Put a simple as-is cash offer in front of the owner with a closing date they choose, then decide whether to renovate or assign.
Motivated Missouri sellers, by lead type
Probate, foreclosure, tax, code, and other distress records for Missouri all sit on ForeclosuresDaily.com’s off-market platform, each checked against tax rolls and property records.
Lead types to work








Using the 70% Rule on Missouri flips
Before naming a price, Missouri flippers and wholesalers estimate what the house will be worth once fixed, known as the after-repair value (ARV).
The rule is simple: offer no more than 70% of ARV, then subtract repairs. Whatever is left funds the carrying period, the closing, and your return on a flip, or your fee on an assigned contract.

In the county cards, the Missouri median listing price stands in for ARV, and repairs are budgeted at 8% of that figure.
70% Rule example
| Step | Amount |
|---|---|
| ARV | $305,000 |
| 70% of ARV | $213,500 |
| Estimated repairs | − $24,000 |
| Maximum offer |
Missouri’s highest-inventory counties
Listing counts put these 10 Missouri counties at the top of the state. Expand a county for prices, values, and max-offer math, then match it to the way you invest.

Below state median · St Louis County · $215,000 · Bargaining room
St Louis County by the numbers
| Metric | Value |
|---|---|
| Median listing price | $215,000 ▼ 17% |
| Price per sq ft | $157 |
| Days on market | 44 days ▲ 7.3% |
| Median rent | $1,600 ▼ 3% |
| Active listings | 4,333 ▲ 16.8% |
| Gross rent yield | 8.9% |
Of the ten counties, St Louis County asks the least to get in, a good fit for first flips and wholesale contracts. The median price has fallen 17% in a year and inventory has climbed 16.8%, which puts sellers on the defensive and gives you bargaining room.
Max offer when the ARV equals the median price: $215,000 × 70% − $17,000 repairs = $133,500 max offer
Also see the full St Louis County market report on Realtor.com →
Then view St Louis County homes on Zillow →

Below state median · Jackson County · $285,000 · Wholesale lead
Jackson County by the numbers
| Metric | Value |
|---|---|
| Median listing price | $285,000 ▲ 3.7% |
| Price per sq ft | $172 |
| Days on market | 50 days ▲ 6.8% |
| Median rent | $1,545 ▼ 3.1% |
| Active listings | 3,993 ▼ 5.9% |
| Gross rent yield | 6.5% |
Moreover, Jackson County posted a Zillow Home Value Index of $249,870 for August 2026, up 2.5% from a year earlier.
Jackson County’s median price is up 3.7% over the year and inventory is down 5.9%. Prices track close to the state median, so profit depends on buying well below market from off-market sellers.
Max offer when the ARV equals the median price: $285,000 × 70% − $23,000 repairs = $176,500 max offer
Also see the full Jackson County market report on Realtor.com →
Then view Jackson County homes on Zillow →

Above state median · St Charles County · $419,900 · Rehab target
St Charles County market snapshot
| Metric | Value |
|---|---|
| Median listing price | $419,900 ▼ 1.2% |
| Price per sq ft | $197 |
| Days on market | 42 days |
| Median rent | $2,350 ▲ 5.9% |
| Active listings | 2,484 ▲ 1.4% |
| Gross rent yield | 6.7% |
Meanwhile, the St Charles County median price is down 1.2% from a year earlier. Higher resale values here reward a carefully planned renovation.
Max offer when the ARV equals the median price: $419,900 × 70% − $34,000 repairs = $259,930 max offer
Also see the full St Charles County market report on Realtor.com →
Then view St Charles County homes on Zillow →
Above state median · Greene County · $339,900 · Wholesale lead
Greene County market snapshot
| Metric | Value |
|---|---|
| Median listing price | $339,900 ▲ 6.2% |
| Price per sq ft | $174 |
| Days on market | 50 days ▲ 6.4% |
| Median rent | $1,399 ▼ 3.5% |
| Active listings | 2,117 ▲ 1.4% |
| Gross rent yield | 4.9% |
In addition, Greene County comes in at $257,748 on the Zillow Home Value Index for August 2026, up 3.1% from a year earlier.
Greene County’s median price is up 6.2% from a year earlier. Prices here are neither hot nor soft, which suits investors who want a dependable pipeline of contracts to assign.
Max offer when the ARV equals the median price: $339,900 × 70% − $27,000 repairs = $210,930 max offer
Also see the full Greene County market report on Realtor.com →
Then view Greene County homes on Zillow →

Above state median · Camden County · $405,000 · Rehab target
Camden County market snapshot
| Metric | Value |
|---|---|
| Median listing price | $405,000 ▲ 2.5% |
| Price per sq ft | $261 |
| Days on market | 79 days ▲ 6.8% |
| Median rent | $1,775 ▲ 18.3% |
| Active listings | 1,878 ▼ 11.1% |
| Gross rent yield | 5.3% |
Meanwhile, in Camden County, the Zillow Home Value Index was $319,708 for August 2026, down 3.4% from a year earlier.
Buyers pay more per square foot in Camden County than in any other county here. The median price is up 2.5% from a year earlier and inventory is down 11.1%, so strong prices can support a full renovation with a healthy margin.
Max offer when the ARV equals the median price: $405,000 × 70% − $32,000 repairs = $251,500 max offer
Also see the full Camden County market report on Realtor.com →
Then view Camden County homes on Zillow →

Above state median · Clay County · $400,000 · Bargaining room
Clay County market snapshot
| Metric | Value |
|---|---|
| Median listing price | $400,000 ▼ 5% |
| Price per sq ft | $191 |
| Days on market | 43 days ▼ 13.3% |
| Median rent | $2,028 ▲ 1.3% |
| Active listings | 1,391 ▼ 3.9% |
| Gross rent yield | 6.1% |
In addition, as of August 2026, Clay County’s Zillow Home Value Index reads $321,462, up 2.4% from a year earlier.
Clay County’s median price is down 5% from a year earlier, and inventory is down 3.9%. Sellers are adjusting to slower demand, so an offer below asking will usually get a hearing.
Max offer when the ARV equals the median price: $400,000 × 70% − $32,000 repairs = $248,000 max offer
Also see the full Clay County market report on Realtor.com →
Then view Clay County homes on Zillow →

Below state median · Taney County · $269,900 · Wholesale lead
Taney County market snapshot
| Metric | Value |
|---|---|
| Median listing price | $269,900 ▼ 1.5% |
| Price per sq ft | $196 |
| Days on market | 92 days ▼ 3.2% |
| Median rent | $1,295 ▼ 7.5% |
| Active listings | 1,323 ▲ 5.1% |
| Gross rent yield | 5.8% |
Similarly, Taney County logged a Zillow Home Value Index of $246,435 in August 2026, down 0.3% from a year earlier.
Taney County homes stay on the market longer than elsewhere on this list, and long waits create motivated sellers. The median price is down 1.5% from a year earlier while inventory is up 5.1%, so off-market leads are your best route to a real discount.
Max offer when the ARV equals the median price: $269,900 × 70% − $22,000 repairs = $166,930 max offer
Also see the full Taney County market report on Realtor.com →
Then view Taney County homes on Zillow →
Above state median · Stone County · $379,900 · Wholesale lead
Stone County market snapshot
| Metric | Value |
|---|---|
| Median listing price | $379,900 ▼ 1.3% |
| Price per sq ft | $238 |
| Days on market | 88 days ▼ 2.2% |
| Median rent | $1,500 ▲ 3.5% |
| Active listings | 1,179 ▲ 6.5% |
| Gross rent yield | 4.7% |
Similarly, Likewise, Stone County’s Zillow Home Value Index reached $325,735 in August 2026, up 3.7% from a year earlier.
Stone County’s median price slipped 1.3% from a year earlier as inventory grew 6.5%.
Max offer when the ARV equals the median price: $379,900 × 70% − $30,000 repairs = $235,930 max offer
Also see the full Stone County market report on Realtor.com →
Then view Stone County homes on Zillow →
Above state median · Jefferson County · $337,900 · Wholesale lead
Jefferson County by the numbers
| Metric | Value |
|---|---|
| Median listing price | $337,900 ▲ 3.4% |
| Price per sq ft | $181 |
| Days on market | 39 days ▼ 9.3% |
| Median rent | $1,600 ▼ 10.9% |
| Active listings | 1,161 ▼ 1.8% |
| Gross rent yield | 5.7% |
Also, Up 4.5% from a year earlier, Jefferson County’s Zillow Home Value Index registered $295,106 in August 2026.
Listings move quickest in Jefferson County, the fastest-selling market in this group, and its median price is up 3.4% from a year earlier.
Max offer when the ARV equals the median price: $337,900 × 70% − $27,000 repairs = $209,530 max offer
Also see the full Jefferson County market report on Realtor.com →
Then view Jefferson County homes on Zillow →
Above state median · Boone County · $429,450 · Rehab target
Boone County market snapshot
| Metric | Value |
|---|---|
| Median listing price | $429,450 ▲ 2.1% |
| Price per sq ft | $198 |
| Days on market | 47 days |
| Median rent | $1,595 ▲ 4.6% |
| Active listings | 947 ▼ 6.6% |
| Gross rent yield | 4.5% |
Moreover, Boone County shows a Zillow Home Value Index of $331,236 for August 2026, up 2.7% from a year earlier.
At the top of this list on median price, Boone County lets a single deal carry a large margin. The median price is up 2.1% from a year earlier and inventory is down 6.6%; in a top-end resale market, a flip pays well when repairs stay on budget.
Max offer when the ARV equals the median price: $429,450 × 70% − $34,000 repairs = $266,615 max offer
Also see the full Boone County market report on Realtor.com →
Then view Boone County homes on Zillow →
Open a county to line its figures up against the others. Listing data: Realtor.com, October 2026. Home values: Zillow Home Value Index, August 2026.
To get gross rent yield, multiply median monthly rent by 12 and divide by the median listing price; repairs in the 70% Rule examples are set at 8% of the median price.
Missouri leads your competitors have not seen yet
ForeclosuresDaily.com has been helping investors, wholesalers, flippers, and agents contact motivated sellers ahead of everyone else since 2004.
Why off-market deals work
Missouri distressed property questions answered
How can I find distressed Missouri homes before they are listed?
Watch the public records that show trouble first: pre-foreclosure notices, probate filings, divorce cases, and tax delinquency. ForeclosuresDaily.com pulls those records daily, giving you time to contact Missouri owners before a listing or an auction date.
Where are Missouri bank-owned and auction homes listed?
You can find bank-owned and auction properties in Missouri on Realtor.com, Zillow, and Auction.com. By the time a home appears there, though, others have seen it; pre-foreclosure leads let you talk with owners while they still control the sale.
Where are Missouri’s lowest entry prices?
St Louis County at $215,000, Taney County at $269,900, and Jackson County at $285,000 have the lowest median listing prices among the counties in this guide, based on Realtor.com data from October 2026. Lower entry prices mean less cash tied up per deal.
Which Missouri county sells homes the fastest?
Jefferson County posts the shortest average time on market in this guide, at 39 days. When homes sell that quickly, investors who reach owners before a listing goes live have the edge over buyers who wait for the MLS.
What makes a Missouri distressed deal profitable to wholesale?
Start with owners who have equity and a real reason to sell soon. Check every property against the 70% Rule, and build your list of cash buyers before you sign a contract you plan to assign.
Get Missouri distressed property leads today
Fresh, targeted, off-market data for St Louis County, Jackson County, St Charles County, and beyond.

Missouri pages by city and county
Distressed properties in Missouri by city and county
Other Missouri local pages
- Connecting Realtors to Sellers in Springfield, MO
- Distressed Real Estate in Jackson County, Missouri
- Distressed Real Estate in St. Charles County, Missouri
- Distressed Real Estate in St. Louis County, Missouri
- Divorce Leads Saint Charles County
- Divorce Real Estate Leads Jackson County Missouri
- Eviction Leads in Greene County, Missouri
- Eviction Leads in Jefferson County, Missouri
- Eviction Leads in St. Charles County, MO
- Eviction Leads in St. Louis, Missouri
- Off-Market Properties in Jackson County, MO
- Off-Market Properties in St. Charles County, MO
- Off-Market Properties in St. Louis County, MO
- Platform Kansas City, MO
- Platform St. Louis
- Real Estate Investing in Jackson County, MO
- Real Estate Investing in St. Charles County, MO
- Realtor Leads in St. Louis, MO
- Realtors to Sellers in Kansas City
- Realtors to Sellers in St. Louis
- Wholesale House Prices Kansas City
- Wholesale Real Estate Kansas City Missouri
- Wholesale Real Estate St. Louis, Missouri
- Wholesaling Real Estate in Greene County, Missouri
- Wholesaling Real Estate in Jackson County, Missouri
- Wholesaling Real Estate in Jefferson County, Missouri
- Wholesaling Real Estate in Saint Charles County, Missouri
- Wholesaling Real Estate in St. Louis County, Missouri
More Missouri guides