South Carolina Foreclosures and Distressed Properties Statewide: Horry to Anderson County Targets
In South Carolina, a listed foreclosure tends to draw a crowd and a bidding war. ForeclosuresDaily.com instead supplies off-market leads on owners who need a quick sale, so you can negotiate directly, away from the MLS.
















Hear From Our Customers
Click a profile to watch their video or read their story.






South Carolina market numbers at a glance
Local market snapshot
Market data: Realtor.com South Carolina housing market, October 2026. Zillow Home Value Index for South Carolina: $306,323 (up 1% from a year earlier), August 2026. View homes on Zillow.
What does distressed mean for a South Carolina property?
Any home whose owner feels pressure to sell counts as distressed. The trigger is usually a life event like a missed mortgage payment, a death in the family, a divorce, overdue property taxes, or repairs that cost more than the owner can pay.

South Carolina’s median listing price is near $360,000, which means a few points of discount can decide whether a flip makes money.
Those points usually come from motivated sellers whose homes are not publicly advertised and not on the Multiple Listing Service (MLS). With fewer buyers in the mix, you can negotiate wholesale pricing rather than bid against retail buyers.
Roughly 5.6 million people call South Carolina home. Ranked by inventory, Horry County, Greenville County, and Spartanburg County are the busiest markets now, and more listings there mean more owners under pressure.
Finding distressed homes across South Carolina
Listing sites show foreclosures only after a bank or auction steps in. South Carolina foreclosures go through the courts, with a lis pendens recorded early, so start well before the Master-in-Equity sale:
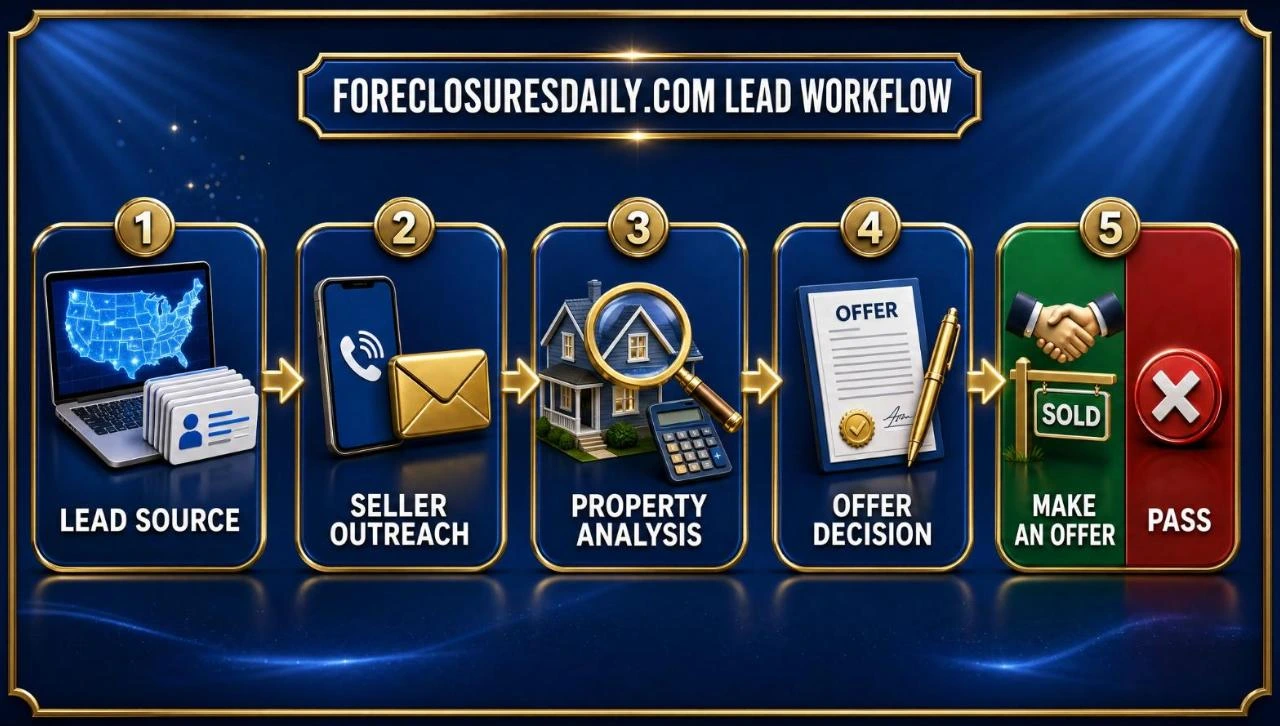
- Pick your counties Begin with a few South Carolina counties where you understand values and have cash buyers lined up.
- Choose lead types Decide which signals to work, since probate, pre-foreclosure, divorce, code violation, and tax delinquency leads each reflect a different motive to sell.
- Use fresh data Because ForeclosuresDaily fresh leads update daily, you can contact South Carolina owners before other investors’ mailers land.
- Target your marketing Targeted data keeps your mail, calls, and texts focused on owners with a genuine reason to sell.
- Run the numbers Pull nearby sales to estimate the after-repair value (ARV), and apply the 70% Rule to it.
- Make a fair offer Fix the seller’s problem with a quick as-is cash closing, and wholesale or flip the property afterward.
South Carolina sellers ready to cash out quickly
Every major distress signal in South Carolina is covered by ForeclosuresDaily.com’s off-market real estate platform, cross-checked against tax rolls and property appraiser records.
Lead types to work









Running ARV and the 70% Rule on a South Carolina flip
In South Carolina, flippers and wholesalers start from the after-repair value (ARV) when setting a maximum offer.
The 70% Rule caps your price at 70% of ARV after subtracting repairs. The spread pays for holding costs, closing costs, and flip profit, or it becomes your assignment fee on a wholesale deal.

The example below uses South Carolina’s median listing price as the ARV with an 8% repair budget.
70% Rule example
| Step | Amount |
|---|---|
| ARV | $360,000 |
| 70% of ARV | $252,000 |
| Estimated repairs | − $29,000 |
| Maximum offer |
Ten South Carolina counties worth targeting
South Carolina’s 10 counties with the most homes for sale appear below. Open a county to view its investing data, and pair that market with your strategy.

Below state median · Horry County · $315,000 · Offer below ask
Horry County market snapshot
| Metric | Value |
|---|---|
| Median listing price | $315,000 ▼ 3.1% |
| Price per sq ft | $226 |
| Days on market | 82 days |
| Median rent | $1,800 |
| Active listings | 10,567 ▲ 1.1% |
| Gross rent yield | 6.9% |
Similarly, Horry County’s Zillow Home Value Index sits at $319,813, up 0.2% from a year earlier, according to August 2026 data.
With the largest inventory on the list, Horry County gives you the most owners to contact. The median price is down 3.1% from a year earlier, and that softer pricing opens room to negotiate with motivated sellers.
Max offer when the ARV equals the median price: $315,000 × 70% − $25,000 repairs = $195,500 max offer
Also see the full Horry County market report on Realtor.com →
Then view Horry County homes on Zillow →

Above state median · Greenville County · $401,450 · Offer below ask
Greenville County market snapshot
| Metric | Value |
|---|---|
| Median listing price | $401,450 ▼ 3.3% |
| Price per sq ft | $202 |
| Days on market | 58 days ▲ 13.7% |
| Median rent | $1,874 ▲ 3% |
| Active listings | 4,832 ▲ 11.9% |
| Gross rent yield | 5.6% |
Meanwhile, Per August 2026 figures, Greenville County’s Zillow Home Value Index is $338,464, which is up 1.9% from a year earlier.
Greenville County’s median price is down 3.3% from a year earlier while inventory is up 11.9%. Sellers adjusting to slower demand there will usually consider offers below asking.
Max offer when the ARV equals the median price: $401,450 × 70% − $32,000 repairs = $249,015 max offer
Also see the full Greenville County market report on Realtor.com →
Then view Greenville County homes on Zillow →
Below state median · Spartanburg County · $308,900 · Wholesale fit
Spartanburg County market snapshot
| Metric | Value |
|---|---|
| Median listing price | $308,900 ▼ 2.8% |
| Price per sq ft | $167 |
| Days on market | 58 days ▲ 9.8% |
| Median rent | $1,674 ▼ 1.5% |
| Active listings | 4,591 ▲ 18.7% |
| Gross rent yield | 6.5% |
In addition, the Zillow Home Value Index for Spartanburg County reached $276,355 in August 2026, up 1.5% from a year earlier.
In Spartanburg County, the median price is down 2.8% from a year earlier and inventory is up 18.7%. Prices sit near the area median, so look for deep discounts from off-market sellers.
Max offer when the ARV equals the median price: $308,900 × 70% − $25,000 repairs = $191,230 max offer
Also see the full Spartanburg County market report on Realtor.com →
Then view Spartanburg County homes on Zillow →
Above state median · Charleston County · $680,000 · Offer below ask
Charleston County market snapshot
| Metric | Value |
|---|---|
| Median listing price | $680,000 ▼ 8.1% |
| Price per sq ft | $373 |
| Days on market | 60 days ▲ 1.7% |
| Median rent | $2,032 ▲ 3.1% |
| Active listings | 3,617 ▲ 2% |
| Gross rent yield | 3.6% |
Similarly, Likewise, Charleston County’s Zillow Home Value Index was $612,976 as of August 2026, a 1.3% gain over a year earlier.
Charleston County has the highest price per square foot on this list. Its median price is down 8.1% from a year earlier, so use the added time on market to build repair costs into your offer.
Max offer when the ARV equals the median price: $680,000 × 70% − $54,000 repairs = $422,000 max offer
Also see the full Charleston County market report on Realtor.com →
Then view Charleston County homes on Zillow →

Above state median · Beaufort County · $529,950 · Offer below ask
Beaufort County market snapshot
| Metric | Value |
|---|---|
| Median listing price | $529,950 ▼ 10.2% |
| Price per sq ft | $335 |
| Days on market | 92 days ▲ 17.9% |
| Median rent | $2,300 |
| Active listings | 3,262 ▲ 0.5% |
| Gross rent yield | 5.2% |
Moreover, August 2026 puts Beaufort County’s Zillow Home Value Index at $553,576, up 1.6% from a year earlier.
Homes in Beaufort County sit longer than elsewhere on the list, and long market times create motivated sellers. The median price there is down 10.2% from a year earlier.
Max offer when the ARV equals the median price: $529,950 × 70% − $42,000 repairs = $328,965 max offer
Also see the full Beaufort County market report on Realtor.com →
Then view Beaufort County homes on Zillow →

Below state median · Richland County · $275,000 · Offer below ask
Richland County market snapshot
| Metric | Value |
|---|---|
| Median listing price | $275,000 ▼ 4.8% |
| Price per sq ft | $150 |
| Days on market | 56 days ▲ 10.2% |
| Median rent | $1,750 ▲ 3.2% |
| Active listings | 3,148 ▲ 14.9% |
| Gross rent yield | 7.6% |
Also, at $244,085, Richland County’s Zillow Home Value Index for August 2026 is up 1.1% from a year earlier.
Richland County has the lowest entry prices in the group, which suits wholesaling and first flips. The median price is down 4.8% from a year earlier, and inventory is up 14.9%.
Max offer when the ARV equals the median price: $275,000 × 70% − $22,000 repairs = $170,500 max offer
Also see the full Richland County market report on Realtor.com →
Then view Richland County homes on Zillow →

Above state median · Berkeley County · $409,684 · Offer below ask
Berkeley County market snapshot
| Metric | Value |
|---|---|
| Median listing price | $409,684 ▼ 4% |
| Price per sq ft | $210 |
| Days on market | 56 days ▼ 0.9% |
| Median rent | $1,900 ▲ 1.9% |
| Active listings | 2,530 ▲ 9.8% |
| Gross rent yield | 5.6% |
Moreover, in Berkeley County, the Zillow Home Value Index measured $372,364 in August 2026, down 0.2% from a year earlier.
Berkeley County’s median price is down 4% from a year earlier, while inventory is up 9.8%.
Max offer when the ARV equals the median price: $409,684 × 70% − $33,000 repairs = $253,779 max offer
Also see the full Berkeley County market report on Realtor.com →
Then view Berkeley County homes on Zillow →
Below state median · Lexington County · $325,000 · Wholesale fit
Lexington County market snapshot
| Metric | Value |
|---|---|
| Median listing price | $325,000 ▼ 0.3% |
| Price per sq ft | $162 |
| Days on market | 51 days ▼ 2% |
| Median rent | $1,850 ▼ 5.1% |
| Active listings | 2,514 ▲ 3.3% |
| Gross rent yield | 6.8% |
Meanwhile, Lexington County recorded a Zillow Home Value Index of $274,268 for August 2026, a 1.7% increase from a year earlier.
Lexington County homes sell faster than any others on the list. The median price is down 0.3% from a year earlier and inventory is up 3.3%, and that steady pricing makes the county a reliable source of wholesale deals.
Max offer when the ARV equals the median price: $325,000 × 70% − $26,000 repairs = $201,500 max offer
Also see the full Lexington County market report on Realtor.com →
Then view Lexington County homes on Zillow →
Above state median · York County · $419,000 · Offer below ask
York County market snapshot
| Metric | Value |
|---|---|
| Median listing price | $419,000 ▼ 3% |
| Price per sq ft | $210 |
| Days on market | 63 days ▲ 20.4% |
| Median rent | $1,639 ▼ 4.2% |
| Active listings | 2,329 ▲ 8.8% |
| Gross rent yield | 4.7% |
In addition, York County’s Zillow Home Value Index slipped to $387,516 in August 2026, down 1.3% from a year earlier.
In York County, the median price is down 3% from a year earlier, and inventory is up 8.8%.
Max offer when the ARV equals the median price: $419,000 × 70% − $34,000 repairs = $259,300 max offer
Also see the full York County market report on Realtor.com →
Then view York County homes on Zillow →
Below state median · Anderson County · $343,895 · Offer below ask
Anderson County market snapshot
| Metric | Value |
|---|---|
| Median listing price | $343,895 |
| Price per sq ft | $178 |
| Days on market | 64 days ▲ 20% |
| Median rent | $1,395 ▼ 2.1% |
| Active listings | 2,174 ▲ 15.5% |
| Gross rent yield | 4.9% |
Similarly, Anderson County’s Zillow Home Value Index stands at $292,313 as of August 2026, up 1.6% from a year earlier.
Anderson County has the smallest inventory on the list, so an off-market lead there faces little competition. Inventory is still up 15.5% from a year earlier.
Max offer when the ARV equals the median price: $343,895 × 70% − $28,000 repairs = $212,726 max offer
Also see the full Anderson County market report on Realtor.com →
Then view Anderson County homes on Zillow →
Pick a county to view its investing data and compare markets side by side. Sources: Realtor.com for October 2026 and the Zillow Home Value Index for August 2026.
The 70% Rule example budgets repairs at 8% of the median price, and gross rent yield is a full 12 months of median rent over the median listing price.
Reach South Carolina off-market sellers ahead of competitors with ForeclosuresDaily
Investors, wholesalers, flippers, and agents have used ForeclosuresDaily.com to get to motivated sellers first since 2004.
Why off-market deals work
South Carolina distressed property and foreclosure FAQ
How do investors track down distressed South Carolina homes before they sell?
Begin with public-record signals like pre-foreclosure, probate, divorce, and tax delinquency. Because South Carolina foreclosures are judicial, a lis pendens is often filed months before the Master-in-Equity sale. ForeclosuresDaily.com gathers these records daily, so you can contact owners before a listing or auction.
How can I locate foreclosed homes in South Carolina?
Bank-owned and auction homes are posted on sites like Realtor.com, Zillow, and Auction.com. Pre-foreclosure leads, found off-market, reach South Carolina owners earlier, often while the case is still pending in the Court of Common Pleas and they can sell on their own terms.
Where are South Carolina’s lowest entry prices?
Richland County has the lowest median listing price of the counties in this guide at $275,000. Spartanburg County follows at $308,900 and Horry County at $315,000, according to Realtor.com data from October 2026, so check current listings before you set a budget.
Which South Carolina county sells homes fastest?
Lexington County posts the shortest average time on market in this guide, 51 days. In a market that quick, the investors who reach owners before a listing goes live have the edge over buyers waiting for the MLS.
What is the smartest way to source South Carolina wholesale deals?
Target owners who have equity and a reason to sell fast. Apply the 70% Rule to each property, and have cash buyers ready before you sign any contract you intend to assign, so the assignment can close without delays.
Get South Carolina distressed property leads today
Fresh, targeted, off-market data for Horry County, Greenville County, Spartanburg County, and beyond.

More South Carolina pages
Other South Carolina local pages
- Distressed Real Estate in Charleston County, South Carolina
- Distressed Real Estate in Greenville County, South Carolina
- Distressed Real Estate in Horry County, SC
- Distressed Real Estate in Lexington County, South Carolina
- Distressed Real Estate in Richland County, South Carolina
- Distressed Real Estate in Spartanburg County, South Carolina
- Divorce Leads Charleston County South Carolina
- Divorce Leads Greenville County
- Divorce Leads Lexington County South Carolina
- Divorce Leads Richland County South Carolina
- Divorce Leads Spartanburg County South Carolina
- Divorce Real Estate Leads Horry County
- Flipping Houses in Charleston, SC
- Flipping Houses in Columbia, SC
- Foreclosure Lis Pendens Greenville County SC
- Foreclosure Lis Pendens in Horry County, SC
- Foreclosure Lis Pendens Lexington County SC
- Foreclosure Lis Pendens Richland County SC
- Foreclosure Lis Pendens Spartanburg County SC
- Off-Market Properties in Charleston, SC
- Off-Market Properties in Greenville County, SC
- Off-Market Properties in Horry County, SC
- Off-Market Properties in Lexington County, SC
- Off-Market Properties in Richland County, SC
- Off-Market Properties in Spartanburg County, SC
- Platform Charleston, SC
- Platform Greenville, SC
- Probate Real Estate Leads in Charleston, SC
- Probate Real Estate Leads in Greenville, SC
- Real Estate Investing in Charleston County, SC
- Real Estate Investing in Greenville County, SC
- Real Estate Investing in Horry County, SC
- Real Estate Investing in Lexington County, SC
- Real Estate Investing in Richland County, SC
- Real Estate Investing in Spartanburg County, SC
- Realtor Leads Charleston County SC
- Realtor Leads Greenville County SC
- Realtor Leads Horry County SC
- Realtor Leads Lexington County SC
- Realtor Leads Richland County SC
- Realtor Leads Spartanburg County SC
- Wholesale Real Estate Greenville South Carolina
- Wholesaling Real Estate in Charleston County, South Carolina
- Wholesaling Real Estate in Charleston, SC
- Wholesaling Real Estate in Greenville County, SC
- Wholesaling Real Estate in Horry County, South Carolina
- Wholesaling Real Estate in Lexington County, South Carolina
- Wholesaling Real Estate in Richland County, South Carolina
- Wholesaling Real Estate in Spartanburg County, South Carolina