Foreclosed Homes in Massachusetts and Distressed Properties for Sale: Right to Cure Notices and Middlesex Data
Across Massachusetts, however, bank-owned homes attract every buyer with a saved search. ForeclosuresDaily.com follows what happens first, from probate cases and right-to-cure notices to unpaid tax bills, so you can open a conversation with a motivated owner long before the auction notice runs in the paper.
























Hear From Our Customers
Click a profile to watch their video or read their story.






The Massachusetts market in numbers
Local market snapshot
Market data: Realtor.com Massachusetts housing market, October 2026. Zillow Home Value Index for Massachusetts: $661,896 (up 2.3% from a year earlier), August 2026. View homes on Zillow.
Which Massachusetts homes count as distressed?
We call a property distressed when its owner has a pressing reason to sell. In Massachusetts that reason is usually a mortgage default, an estate settling after a death, a divorce, back property taxes, or an older house that needs more work than the owner can pay for.

Indeed, those owners carry extra weight in the Bay State, where listings hover around $725,000 and a retail purchase leaves almost no spread for an investor.
Instead, your discount lives with sellers who have not advertised, are open to a private sale and have no listing on the Multiple Listing Service (MLS). As a result, fewer buyers compete for those homes, which leaves room to agree on a true wholesale price.
About 7.1 million people live in Massachusetts, and Middlesex County, Worcester County and Suffolk County currently hold the most listings, which also means the largest pools of owners feeling pressure.
Getting ahead of Massachusetts foreclosure auctions
By the time a Massachusetts home shows up on an auction or REO site, the lender has already published its sale notice. Deals come from working the months before that:
- Pick your counties Above all, keep your opening campaigns to two or three Massachusetts counties where you can price homes confidently and already have cash buyers.
- Choose lead types Each record type, whether probate, pre-foreclosure, divorce, code violation or tax delinquency, reflects its own reason to sell, so match the list to the deals you close best.
- Use fresh data In particular, ForeclosuresDaily adds new leads daily. Therefore, you can reach a Massachusetts owner right after a filing and ahead of the stack of investor mail.
- Target your marketing When each Massachusetts list is filtered by its distress record, every postcard, call and text lands with an owner who has a concrete reason to move.
- Run the numbers Then use recent sold comps nearby to estimate the after-repair value (ARV), and hold every deal to the 70% Rule.
- Make a fair offer Offer a quick, as-is cash closing that takes the problem off the owner’s hands, and either assign the contract or renovate the home.
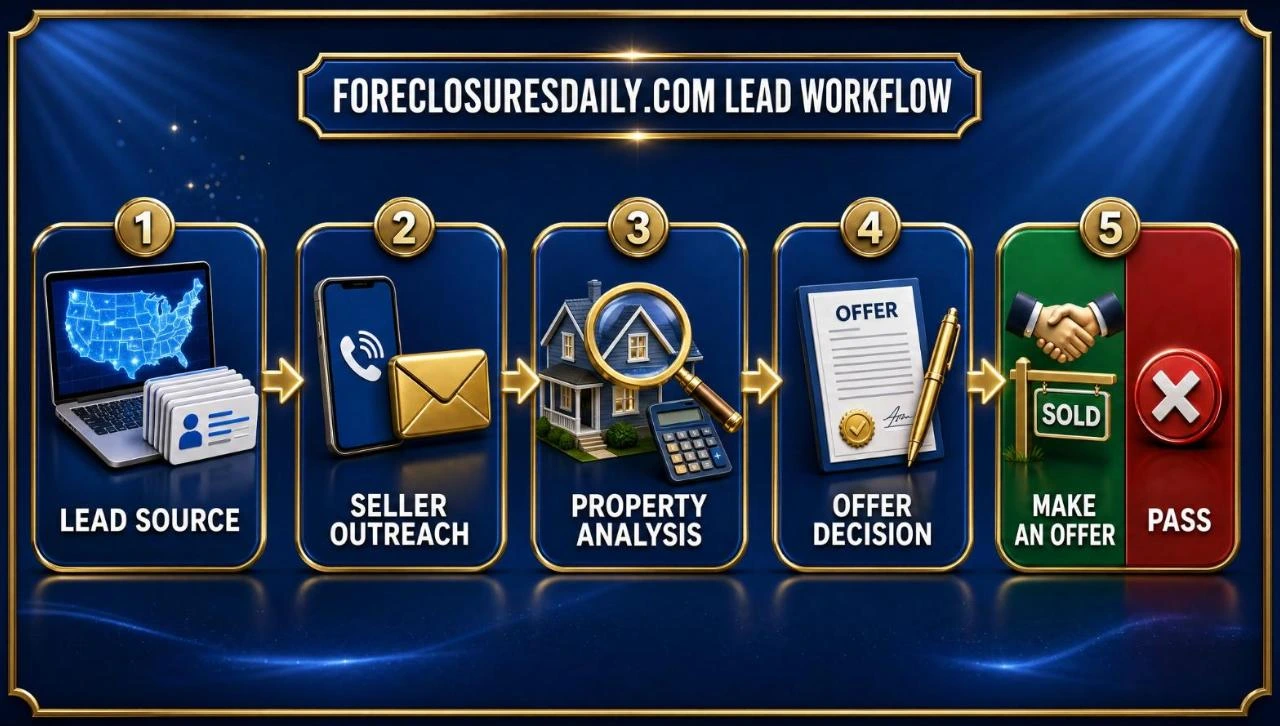
Massachusetts sellers under a deadline
In addition, every major distress record we track in Massachusetts lands on one ForeclosuresDaily.com off-market platform, matched against local tax rolls and assessor property data.
Lead types to work









Running Bay State deals through ARV and the 70% Rule
Before you offer on any Massachusetts flip or wholesale contract, estimate the after-repair value (ARV); it caps what you can pay.
Then the 70% Rule limits your price to 70% of ARV less the repair budget. Finally, whatever remains has to cover carrying costs, closing costs and your profit on a flip, or it serves as your assignment fee on a wholesale deal.

For instance, each calculation on this page plugs in the local median listing price as the ARV and reserves 8% of it for repairs.
70% Rule example
| Step | Amount |
|---|---|
| ARV | $725,000 |
| 70% of ARV | $507,500 |
| Estimated repairs | − $58,000 |
| Maximum offer |
Where Massachusetts listings are piling up, county by county
Here, in particular, are the 10 Massachusetts counties holding the most homes for sale. Then expand any county for its numbers and see which market lines up with how you invest.

Above state median · Middlesex County · $849,900 · Negotiate
Middlesex County: the numbers
| Metric | Value |
|---|---|
| Median listing price | $849,900 ▼ 4.8% |
| Price per sq ft | $458 |
| Days on market | 51 days ▲ 17.9% |
| Median rent | $3,180 ▲ 0.2% |
| Active listings | 4,650 ▲ 18.7% |
| Gross rent yield | 4.5% |
Meanwhile, Middlesex County’s Zillow Home Value Index came to $814,047 in August 2026, 1.6% above the level a year earlier.
Moreover, Middlesex leads this list in inventory, so it offers the widest pool of owners to contact. For instance, its median price fell 4.8% in a year as listings grew 18.7%. As a result, that cooling gives you leverage with sellers who need a quick result.
Max offer when the ARV equals the median price: $849,900 × 70% − $68,000 repairs = $526,930 max offer
Also see the full Middlesex County market report on Realtor.com →
Then view Middlesex County homes on Zillow →

Below state median · Worcester County · $549,998 · Flip & wholesale
Worcester County: the numbers
| Metric | Value |
|---|---|
| Median listing price | $549,998 ▼ 1.8% |
| Price per sq ft | $297 |
| Days on market | 46 days ▲ 24.3% |
| Median rent | $2,250 ▼ 2.2% |
| Active listings | 3,569 ▲ 22% |
| Gross rent yield | 4.9% |
For Worcester County, the Zillow Home Value Index stood at $498,010 in August 2026, up 1.9% from a year earlier.
Worcester’s median price eased 1.8% over the year while inventory rose 22%. Lower prices also mean less cash tied up in a wholesale assignment or a cosmetic flip.
Max offer when the ARV equals the median price: $549,998 × 70% − $44,000 repairs = $340,999 max offer
Also see the full Worcester County market report on Realtor.com →
Then view Worcester County homes on Zillow →
Above state median · Suffolk County · $816,333 · Negotiate
Suffolk County: the numbers
| Metric | Value |
|---|---|
| Median listing price | $816,333 ▼ 3.7% |
| Price per sq ft | $809 |
| Days on market | 65 days ▲ 6.6% |
| Median rent | $3,250 ▼ 0.9% |
| Active listings | 2,850 ▲ 18.1% |
| Gross rent yield | 4.8% |
Suffolk County posted a Zillow Home Value Index of $750,961 for August 2026, 0.4% higher than a year earlier.
In fact, Suffolk tops this list on price per square foot. The median price slipped 3.7% over the year and listings climbed 18.1%, so Boston-area sellers facing slower traffic will often hear out an offer under asking.
Max offer when the ARV equals the median price: $816,333 × 70% − $65,000 repairs = $506,433 max offer
Also see the full Suffolk County market report on Realtor.com →
Then view Suffolk County homes on Zillow →
Above state median · Essex County · $749,894 · Negotiate
Essex County market snapshot
| Metric | Value |
|---|---|
| Median listing price | $749,894 ▲ 0.4% |
| Price per sq ft | $413 |
| Days on market | 46 days ▲ 21.9% |
| Median rent | $2,625 ▼ 2.8% |
| Active listings | 2,536 ▲ 21.9% |
| Gross rent yield | 4.2% |
In Essex County the Zillow Home Value Index reached $722,540 as of August 2026, a gain of 2.1% from a year earlier.
Essex saw its median price tick up 0.4% while inventory jumped 21.9%. Meanwhile, homes there now sit longer, which gives you room to fold repair costs into your offer.
Max offer when the ARV equals the median price: $749,894 × 70% − $60,000 repairs = $464,926 max offer
Also see the full Essex County market report on Realtor.com →
Then view Essex County homes on Zillow →

Above state median · Plymouth County · $735,000 · Negotiate
Plymouth County market snapshot
| Metric | Value |
|---|---|
| Median listing price | $735,000 ▲ 0.7% |
| Price per sq ft | $389 |
| Days on market | 45 days ▲ 11.1% |
| Median rent | $2,855 ▼ 3.2% |
| Active listings | 2,414 ▲ 12.4% |
| Gross rent yield | 4.7% |
Plymouth County’s Zillow Home Value Index was $653,336 in August 2026, 4.1% above its reading a year earlier.
Similarly, the Plymouth County median price rose 0.7% in a year, and its listings grew 12.4%.
Max offer when the ARV equals the median price: $735,000 × 70% − $59,000 repairs = $455,500 max offer
Also see the full Plymouth County market report on Realtor.com →
Then view Plymouth County homes on Zillow →

Above state median · Norfolk County · $799,900 · Negotiate
Norfolk County market snapshot
| Metric | Value |
|---|---|
| Median listing price | $799,900 ▼ 8.6% |
| Price per sq ft | $456 |
| Days on market | 47 days ▲ 9.3% |
| Median rent | $3,011 ▼ 4% |
| Active listings | 2,297 ▲ 16.8% |
| Gross rent yield | 4.5% |
The Zillow Home Value Index for Norfolk County hit $773,309 in August 2026, up 2.3% from a year earlier.
Norfolk County’s median price is 8.6% lower than a year ago, while its inventory is 16.8% higher.
Max offer when the ARV equals the median price: $799,900 × 70% − $64,000 repairs = $495,930 max offer
Also see the full Norfolk County market report on Realtor.com →
Then view Norfolk County homes on Zillow →

Below state median · Bristol County · $575,000 · Negotiate
Bristol County market snapshot
| Metric | Value |
|---|---|
| Median listing price | $575,000 ▼ 6.9% |
| Price per sq ft | $329 |
| Days on market | 46 days ▲ 43.8% |
| Median rent | $2,100 |
| Active listings | 2,091 ▲ 22.3% |
| Gross rent yield | 4.4% |
Also, Bristol County showed a Zillow Home Value Index of $549,102 in August 2026, which is 3.9% above the prior year.
However, the Bristol County median price dropped 6.9% over the year as listings climbed 22.3%.
Max offer when the ARV equals the median price: $575,000 × 70% − $46,000 repairs = $356,500 max offer
Also see the full Bristol County market report on Realtor.com →
Then view Bristol County homes on Zillow →
Above state median · Barnstable County · $899,000 · Wholesale
Barnstable County market snapshot
| Metric | Value |
|---|---|
| Median listing price | $899,000 ▼ 2.8% |
| Price per sq ft | $566 |
| Days on market | 61 days ▼ 15.3% |
| Median rent | $2,650 ▼ 0.9% |
| Active listings | 2,076 ▼ 7% |
| Gross rent yield | 3.5% |
Barnstable County’s Zillow Home Value Index registered $762,440 in August 2026, 2.4% higher than a year earlier.
Cape Cod’s Barnstable County carries the highest median price on this list, so a single deal can produce a large spread. Still, its median fell 2.8% and inventory shrank 7%, which keeps prices firm and makes deep off-market discounts the real opportunity.
Max offer when the ARV equals the median price: $899,000 × 70% − $72,000 repairs = $557,300 max offer
Also see the full Barnstable County market report on Realtor.com →
Then view Barnstable County homes on Zillow →
Below state median · Hampden County · $379,900 · Flip & wholesale
Hampden County market snapshot
| Metric | Value |
|---|---|
| Median listing price | $379,900 ▲ 7% |
| Price per sq ft | $238 |
| Days on market | 39 days ▲ 34.5% |
| Median rent | $1,850 ▲ 2.8% |
| Active listings | 1,524 ▲ 14.2% |
| Gross rent yield | 5.8% |
The Hampden County Zillow Home Value Index reached $354,728 in August 2026, 4.1% above the year before.
However, Hampden offers the lowest entry price in this group, a good match for wholesale assignments and first rehabs around Springfield. Its median rose 7% and listings rose 14.2%, and the low buy-in still leaves space for a fee or a fast resale.
Max offer when the ARV equals the median price: $379,900 × 70% − $30,000 repairs = $235,930 max offer
Also see the full Hampden County market report on Realtor.com →
Then view Hampden County homes on Zillow →
Below state median · Berkshire County · $549,900 · Flip & wholesale
Berkshire County market snapshot
| Metric | Value |
|---|---|
| Median listing price | $549,900 ▲ 3.8% |
| Price per sq ft | $290 |
| Days on market | 62 days ▲ 5.1% |
| Median rent | $2,000 ▼ 9.1% |
| Active listings | 1,135 ▲ 0.4% |
| Gross rent yield | 4.4% |
For Berkshire County the Zillow Home Value Index came in at $391,869 in August 2026, 1.8% higher than a year earlier.
Berkshire has the thinnest inventory in this guide, so an off-market lead there faces few rival buyers. Likewise, its median price climbed 3.8% over the year. Moreover, cash buyers shopping at that price point tend to take wholesale contracts quickly.
Max offer when the ARV equals the median price: $549,900 × 70% − $44,000 repairs = $340,930 max offer
Also see the full Berkshire County market report on Realtor.com →
Then view Berkshire County homes on Zillow →
Expand a county to see its figures and compare one Massachusetts market with another. Listing data reflects Realtor.com for October 2026, whereas home values reflect the Zillow Home Value Index for August 2026.
In addition, we calculate gross rent yield as 12 months of median rent over the median listing price, and every 70% Rule example sets repairs at 8% of that price.
Find Massachusetts sellers before the auction notice
Bay State buyers have had ForeclosuresDaily.com on their side since 2004, and investors, wholesalers, flippers and agents still rely on it to beat the crowd to motivated sellers.
Why off-market deals work
Your Massachusetts distressed-home questions, answered
What records point to distressed homes in Massachusetts?
In general, public filings that signal trouble early are the best source: pre-foreclosure notices, probate cases, divorce filings and overdue property taxes. ForeclosuresDaily.com collects these every day, so you can contact a Massachusetts owner during the 90-day right-to-cure window, well before the lender publishes a sale notice or the home is listed.
Which websites advertise Massachusetts bank-owned and auction homes?
For example, Realtor.com, Zillow and Auction.com post bank-owned and auction homes across Massachusetts. Pre-foreclosure leads reach owners much earlier, while they can still pick their own sale terms, which matters here because the state allows no redemption once the foreclosure auction is held.
If my budget is tight, which Massachusetts counties should I look at?
Specifically, Realtor.com numbers from October 2026 put the lowest median listing prices in this guide in Hampden County at $379,900, followed by Berkshire County at $549,900 and Worcester County at $549,998. Those western and central counties let you start with a smaller cash outlay than the Boston area.
Which Massachusetts county has the quickest sales?
In fact, Hampden County records the shortest average time on market in this guide at 39 days. A county that turns over that fast rewards investors who speak with owners before a listing goes up, since a fairly priced house can be under agreement within a few weeks.
Can a Massachusetts wholesaler profit from distressed homes, and how?
Target owners who hold real equity and face a deadline, such as an estate or a pending foreclosure auction. Test every deal against the 70% Rule, and have cash buyers ready before you sign any purchase and sale agreement you intend to assign.
Get Massachusetts distressed property leads today
Fresh, targeted, off-market data for Middlesex County, Worcester County, Suffolk County, and beyond.

More Massachusetts pages
Other Massachusetts local pages
- Bristol County Realtor Leads
- Distressed Real Estate in Bristol County, Massachusetts
- Distressed Real Estate in Hampden County, Massachusetts
- Distressed Real Estate in Middlesex County, Massachusetts
- Distressed Real Estate in Norfolk County, Massachusetts
- Distressed Real Estate in Plymouth County, Massachusetts
- Distressed Real Estate in Suffolk County, Massachusetts
- Distressed Real Estate in Worcester County, Massachusetts
- Divorce Leads Norfolk County
- Divorce Leads Worcester County
- Eviction Leads in Bristol County, Massachusetts
- Eviction Leads in Essex County, Massachusetts
- Eviction Leads in Hampden County, Massachusetts
- Eviction Leads in Middlesex County, Massachusetts
- Eviction Leads in Norfolk County, Massachusetts
- Eviction Leads in Plymouth County, MA
- Eviction Leads in Suffolk County, Massachusetts
- Eviction Leads in Worcester County, MA
- Flipping Houses in Boston, MA
- Off-Market Properties in Bristol County, MA
- Off-Market Properties in Essex County, MA
- Off-Market Properties in Hampden County, MA
- Off-Market Properties in Middlesex County, MA
- Off-Market Properties in Norfolk County, MA
- Off-Market Properties in Plymouth County, MA
- Off-Market Properties in Suffolk County, MA
- Off-Market Properties in Worcester County, MA
- Platform Boston, MA
- Probate Real Estate Investing in Boston, MA
- Probate Real Estate Investing in Essex County, MA
- Real Estate Investing in Bristol County, MA
- Real Estate Investing in Essex County, MA
- Real Estate Investing in Hampden County, MA
- Real Estate Investing in Middlesex County, MA
- Real Estate Investing in Norfolk County, MA
- Real Estate Investing in Plymouth County, MA
- Real Estate Investing in Suffolk County, MA
- Realtor Leads Essex County MA
- Realtor Leads Hampden County MA
- Realtor Leads in Boston, MA
- Realtor Leads Middlesex County MA
- Realtor Leads Norfolk County MA
- Realtor Leads Plymouth County MA
- Realtor Leads Suffolk County MA
- Realtor Leads Worcester County MA
- Wholesale House Prices Boston
- Wholesale Real Estate in Brockton, MA
- Wholesale Real Estate in Cambridge, MA
- Wholesale Real Estate in Lynn, MA
- Wholesale Real Estate in New Bedford, MA
- Wholesale Real Estate in Quincy, MA
- Wholesale Real Estate in Springfield, MA
- Wholesale Real Estate in Worcester, MA
- Wholesale Real Estate Lowell Massachusetts
- Wholesaling Real Estate Bristol County MA
- Wholesaling Real Estate Essex County MA
- Wholesaling Real Estate Hampden County MA
- Wholesaling Real Estate in Boston, MA
- Wholesaling Real Estate in Norfolk County, Massachusetts
- Wholesaling Real Estate in Plymouth County, Massachusetts
More Massachusetts guides